Measuring Erosion
Caused by Boat Wakes over Time, and other Effects
comments, additions, questions: webmaster@BoatWakes.org
Measuring Erosion per trip
Distances from Shore
Cited by Different Authorities
In England, boats in the Norfolk
Broads, East Anglia, erode the banks and suspend bottom sediment, killing
submerged plants which a century ago kept the water clean and prevented
erosion. "Aquatic plants not only reinforce the strength of the submerged
bank material through their root system but they also help reduce fluid forces
acting on the bank by increasing the frictional resistance) (Payne & Hey
p.11).
"Records
from the early 20th century tell of fish visible amongst the weeds
and water lilies in most of the Broads and rivers in depths up to 1-2 metres. Today [1982] much of the previously abundant macrophyte population is absent or restricted and
visibility is limited to a few centimeters in most cases" (Payne & Hey
p.13).
The
Broads are shallow lakes "resulting from the flooding of medieval peat
diggings after a rise in sea level during the 14th and 15th
centuries" (Garrad & Hey p. 290).
Payne
& Hey (p.3) used Ordnance Survey maps to compare river widths from 1883
to 1976. At 18 points the river became 5cm wider per year on average from the
slight erosion during 1883-1946, but then grew 21cm wider per year from
1946-76, with many more and faster boats.
Speed
limits were gradually imposed on more and more of the rivers, until by 1979 all
rivers had a 7mph limit. This meant boat rental yards could adjust the motors
not to exceed 7 mph, which "has had a significant effect in reducing the
number of craft found exceeding maximum speed limits" (Payne & Hey p.
5). The study counts boat traffic at various points on two August days in 1976,
but this is not representative enough to say how many boat passages per year
contribute to the measured erosion.
Garrad & Hey experimented with 7 types of boats at speeds below 7mph (3.1
m/sec). Each boat had a threshold speed where it began to stir up bottom
sediments. Even the best designed boat stirred up sediment at 4.6 mph, and 4 of
the 7 stirred up sediment at less than 2 mph (see graph). The study did
not determine whether sediment was coming from the bottom or sides of the
channel, and did not say the depth of the channel. It also did not say the
depth or weight of the boats, though those specifications could be obtained
from the manufacturers.
Garrad & Hey also measured suspended sediment each hour for two days at
four sites. Two sites where boats were not allowed had little variation
from hour to hour. Two sites where boats were allowed had peaks of
suspended sediment each afternoon, which the authors attribute to boats. The
site with more boat traffic had higher peaks in the afternoons. So they
recommended more control of boat wakes.
S. J. Payne and R. D. Hey, River
Management to Reduce Bank Erosion, Yare and Bure River System, January
1982, Broads Authority, Norwich
P.
N. Garrad and R. D. Hey, "Boat
Traffic, Sediment Resuspension and Turbidity in a Broadland River,"
1987, Journal of Hydrology 95:289-297
Virginia did
a study in 1976 of erosion on the Chesapeake Bay shorelines in Virginia. Like
England, they compared old maps with newer ones, and found on average shores
retreating at 9 inches per year (.73 feet or 23 cm). This is even more than the
10cm (4 inch) per year average in England from 1883-1976. While the English
study measured change up to 1946, and then to 1976, the Virginia study
primarily measured change up to 1942, so they cannot tell if erosion increased
after speedboats became more common, as happened in England.
The
average erosion ranged as high as 18 inches per year in Accomack County on the
eastern shore of the Chesapeake Bay (p.10 and table).
Among
the causes of erosion, the authors discussed waves caused by wind and the rise
in sea level relative to the land, which they put at .01 feet per year (p. 2).
The Baltimore tide gauge confirms an average rise of .01 feet per year from
1903-2005 (3.1mm/yr, spreadsheet, from PSMSL data). The authors
provide the height of each eroded area, and the total area and volume eroded,
so the average height of shores can be calculated at 7.9 feet (p.5 and table; there are many
cliffs). With such substantial shores, the .01 foot annual rise in sea level
does not explain the .73 average retreat of the shoreline. Even at a gentle 5%
slope, .01 foot rise creates only .20 foot retreat, leaving most of the retreat
caused by waves or wakes.
The
authors did not discuss boat wakes as a cause of erosion. While wakes may or
may not have been significant before 1942 there is now substantial traffic of
small boats throughout the Chesapeake Bay, and of large ships going to the Port
of Baltimore and Hampton Roads.
It
is puzzling that p.3 says the newer maps they used were from the 1950s, while
the actual list of maps on p.12 shows 92 out of 115 were dated 1941 or 1942.
These were done by the US Geological Survey (p.3). The older maps were done by
the Coast & Geodetic Survey (p.3) and most were dated from 1849-1868 (88
out of 115, p.12). A surprising number, 20, were dated in 1862, then none until
1868 (p.12). It is questionable whether a US agency was doing accurate surveys
of Virginia shorelines in 1862, since Virginia seceded in April 1861. It is
easy to see why maps of a hostile shore would be done in wartime, but their
accuracy would not be comparable to maps done in peacetime. On the other hand
if these maps were printed in 1862 from surveys done earlier, one wonders why a
nation at war would print maps the enemy could use. The authors use the number
of years between maps to calculate erosion per year, so the actual dates of
survey matter, and the authors do not discuss why so many were dated in war
time.
Shoreline
Erosion in Tidewater Virginia, by Robert. J. Byrne, and Gary. L. Anderson, 1976, Virginia
Institute of Marine Science (VIMS), Chesapeake Research Consortium Report No.
8, Special Report in Applied Marine Science and Ocean Engineering (SRAMSOE) No.
111.
In the Atlantic Intracoastal Waterway, in Florida, Price measured erosion in a 40 mile stretch , and reported it in a
NOAA technical report. 170 acres were eroded between 1970/1971 and 2002. He
studied the effects of boat wakes and wind waves and found, "Exposure to
boat wakes was found to be the causal factor most strongly correlated".
His estimate was that boat wakes caused banks to erode an average 1.3 feet per
year (13 meters over 32 years). He did not have a count of boat passages to
determine erosion per passage. http://nerrs.noaa.gov/TechnicalReport/channel_erosion.html
Quebec, Canada: map of
400 kilometers of shore line being eroded in the Montreal-Sorel sector of
Quebec (on the St Lawrence River at 46.1N,
73W) with the worst area eroding at 1.65 meters/year (5.4'). 2018
update (in French)
Photo
of wave patterns even from slow-moving sailboats
Discussions of Erosion
A study
of the impact of boating on Loch Lomond,
Scotland mentioned wave action causing erosion and cloudiness, as
well as noise and presence of boats harming birds by driving them from their
nests, tiring them and increasing predation. They cite studies where increased
boating led to less wildlife.
Reports
on Venice, Italy note damage to
foundations of historic buildings, even though canals are stone-lined. Boat
wakes shift the stones and cause erosion of the soft ground behind them.
The
Conservancy
of SW Florida makes the point that Jet-Skis & other personal watercraft
go fast in much shallower water than other boats, so they disturb nests on
shorelines more. They say therefore virtually all National Wildlife Refuges and
National Parks ban them (1999). They also note the oil pollution from older
versions with 2-stroke engines.
Dahlgren
& Korschgren (1992) have an annotated bibliography
of the effect of boats on waterfowl.
Minnesota
says that boats on plane create bigger waves and more erosion than boats
going slowly (which they note create 5-inch wakes). They say,
"Many
runabouts and larger fishing craft create a wake approximately 10 inches high
when they are on plane, while large displacement hulls (cruisers and
houseboats) can create a wake about 25 inches high or more. Hydrologists
estimate a wake 10 inches high is five times as destructive to the shoreline as
a 5-inch wake, while the wake that is 25 inches high has a destructive
potential that is 30 times greater."
They
analyzed erosion on the upper Mississippi river in an area where recreational
boat traffic was in a separate channel from barge traffic, and found the
recreational traffic caused more erosion than barge traffic, "as much as
two feet per year on the inside of a riverbend and up
to 14 feet on the outside of the riverbend over a
three-year period!" (their exclamation point)
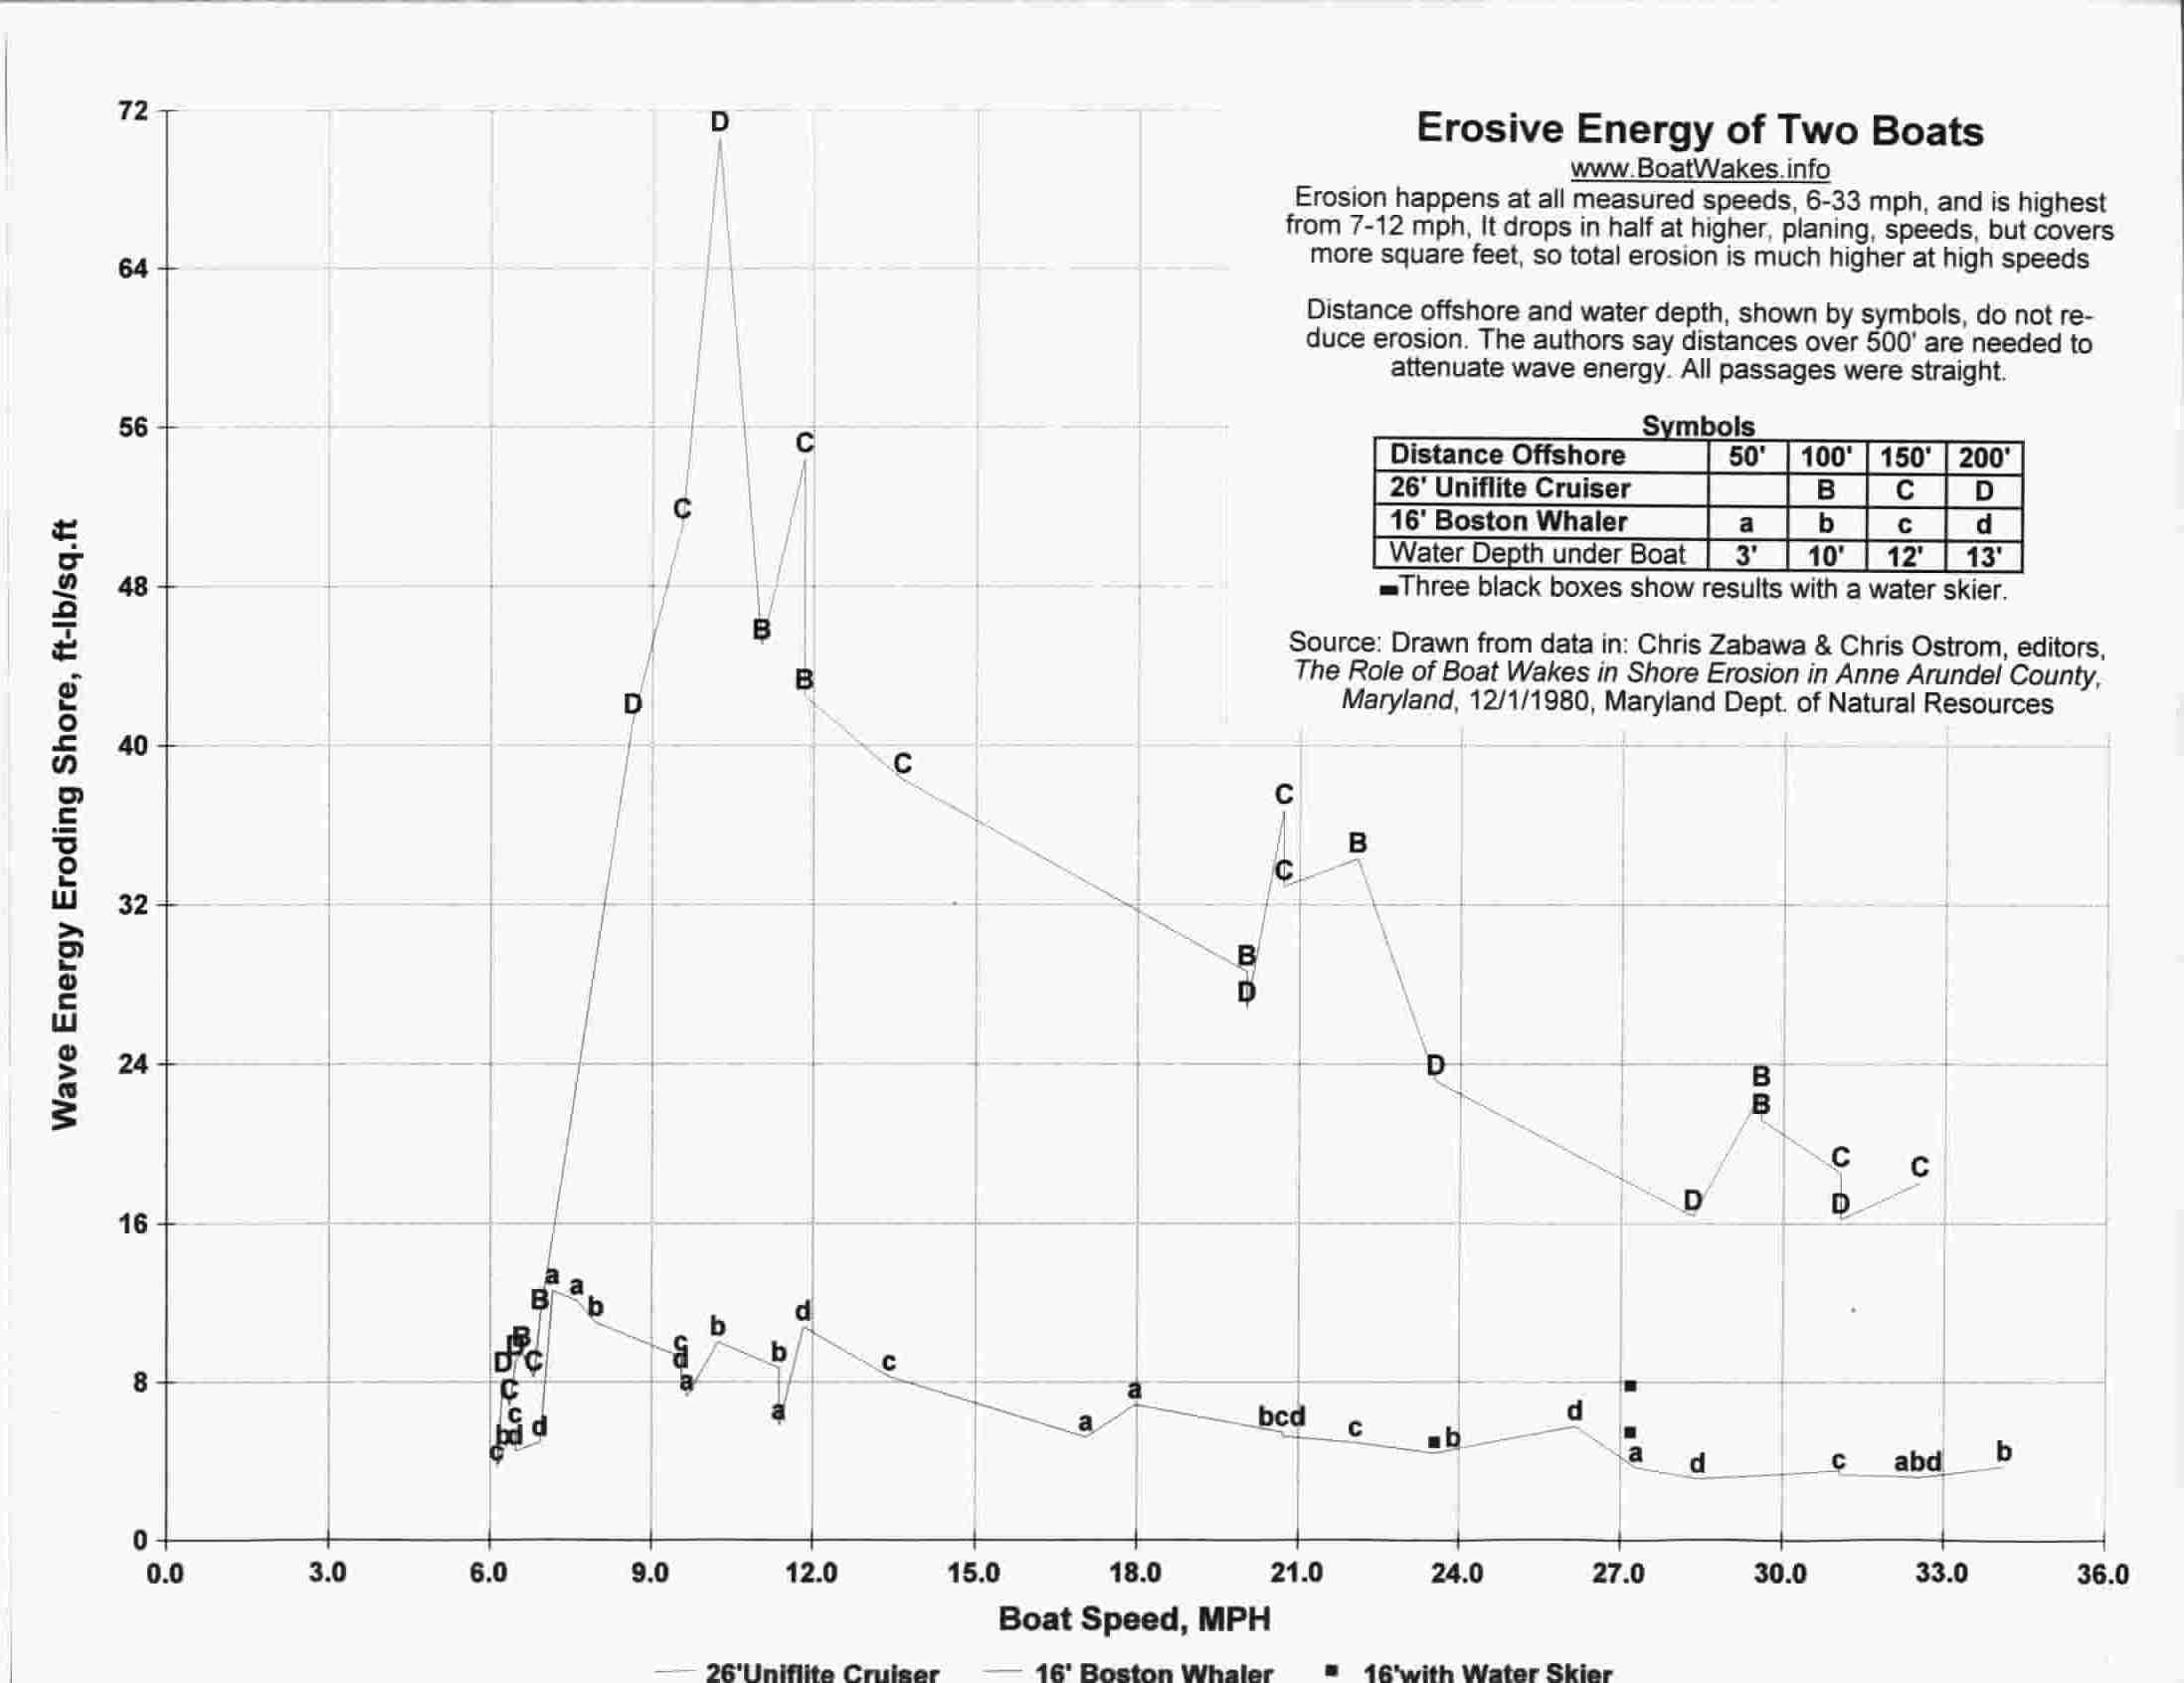
CEDS cites
Maryland's Zabawa & Ostrom
study, summarized here,
and emphasizes that a distance 500 feet offshore is needed to attenuate wave
energies, and that in depths under 13 feet, the maximum wake effects happen at
8-11 mph, so a small excess in a 6 mph zone causes maximum damage.
Nanson
et al. (p.2) quote Limerinos & Smith finding that
in a narrow California channel not subject to winter floods, boat wakes
created 80% of the annual erosive force on banks (wind waves 20%). In a channel
with winter floods, boat wakes created 20% of the erosive force. (Gerald Nanson, Axel von Krusenstierna,
Edward Bryant, and Martin Renilson,
"Experimental Measurements of River-bank Erosion Caused by Boat-generated
Waves on the Gordon River, Tasmania," 1994 Regulated Rivers: Research
and Management 9:1-14)
Torpedo
Bay in Auckland, New Zealand, has much more wave action from wakes than
from wind (Osborne
& Boak, 1999).
Nanticoke River in Delaware is 300
feet wide, eroded by regular passages of barges and 50-60 foot pleasure boats (38.6N, 75.7W)
Eroded sediment harms
life downstream in the Chesapeake bay
Ruby
Lake National Wildlife refuge had to protect shores from boating
erosion.
Distances from Shore, Cited by Different Authorities
|
|||
|
Source |
Distance (meters) |
Distance (feet) |
Description
|
|
400 |
1,300 |
Wake energy does not attenuate at
least up to this distance |
|
|
150 |
500 |
Wakes should not be made within
this distance of shore |
|
|
Maryland DNR study |
150 |
500 |
Boat wakes do not harm shore when
boat is outside this distance from shore; recommend "no wake"
within this distance of shore |
|
Maryland DNR study |
60 |
200 |
1 boat passage raises sediment in
water from 5 parts per million to 440ppm |
|
60 |
200 |
5 knot speed limit applies within
this distance of shore |
|
|
Ohio parks |
30-90 |
100-300 |
Must use idle speed, or make no
wake; distance depends on area, but is not posted |
|
Maryland |
30 |
100 |
6 mph speed limit applies, not
posted |
Click for
research on wave decay